Microsoft developers hear a lot about tools that will make them write faster, more efficient, more refactored, more unit tested code all the time. People don’t often talk of tools that help you to visualise your project’s growing code smell though – among other reasons, everyone’s inner sense of pride may be a behind this, however unless you or your employer has forked out the $11,879 odd dollars for Visual Studio Ultimate Edition you don’t have much to go on without more than the basic reporting on Cylcomatic Complexity, Dependency Depth and Class coupling reports that come in the pro and premium editions. These don’t really help you pin point any of your architectural problems that well – something where NDepend proves itself to be a diamond in the rough.
 Lately I have been reviewing a number of projects both at work and at home from afar. I haven’t been involved in their everyday development, but I have been responsible for them. This has meant that to save myself going insane I’ve had to look at ways to keep an eye on these project’s code quality and architecture without reading every line of every commit from my team.
This lead to me to looking heavily into Static Analysis tools like Nitriq and NDepend. For me NDepend was definitely the winner between the two because of both its ease of integration with Continuous Integration and custom CQL language for specifying custom rules to audit my codebase.
A Cure For Common Developer Guilt
Let’s all admit something right now – although everyone has the best of intentions when writing code for a new project, software development is more art form than process and when time constraints and pressure get in the way we all create our own dirty little secrets. You know what I'm talking about here – the project you are really proud of, but if you met a developer who was as skilled or more so than you, you wouldn’t let them 10 feet near your codebase for fear they catch a bad reflection of your capabilities.
We’ve all got these projects.
Maybe you justify them to yourself;
“I really didn’t want to over-engineer such a simple project”
or
“The public API was so clean before I went and added feature X”
What's more than us all having these projects, most of us have also dealt with the guilt of wishing they had the time or power to do something about it. Static Analysis tools like NDepend help us solve this problem with minimal effort. They allow us to actually see where we may have made bad architectural decision by helping you to both visualize and quantify our codebase’s not so nice bits.
When you can get all this functionality from only 299 Euros per license (you would only need one or two of you team to run NDepend), the value you get back in terms of cost savings from increased maintainability can be considerable when compared to the functionality it offers compared to the ~$11,000 it costs per license for Visual Studio Ultimate.
What is NDepend and Why do I care?
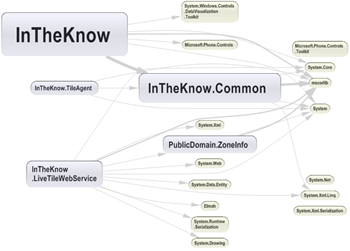
NDepend is basically a Swiss army knife for getting a view on all sorts of metrics and visuals on your codebase – and I'm not talking about telling you how many lines of code your solution has. I’m talking about showing you diagrams showing class dependency, architecture, logical flow; things that actually let you get a really good feel for how your application is architected without reading through your whole codebase.
My Windows Phone 7 application InTheKnow’s Dependancy Graph from NDepend
Installation
Installing NDepend is dead simple, they provide all the binaries in a single zip file.
This may strike you as a bit strange considering this is a project designed to conduct black magic voodoo on your codebase in Microsoft development land of all places (“Where the hell is my pretty installer/MSI biatch!?”). But after discussing this with the developers at NDepend and hearing their reasoning it makes perfect sense and i agree that this is an awesome way to go about things…
“Why” you ask?
Its dead simple: Think Continuous Integration.
I’ve blogged before that I strongly believe that when it comes to using Third Party tools that “They Belong in Source Control”, and having the entire application running without dependencies on the Registry or user profile files really helps achieve this.
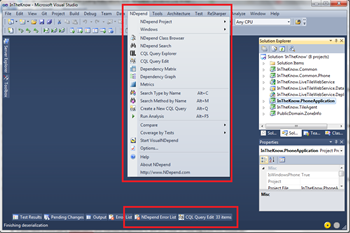
While having an XCopy approach to installation helps with Continuous Integration, it’s awesome to know that there is also a ‘dainty’ Visual Studio installer that will add custom menu and report additions to Visual Studio 2005, 2008, 2010. This give you the option to have your metrics run every time you build your solution if you wish – something which from my testing only adds a matter of seconds to even a large project.
Reports a’plenty
If you have never used a static analysis tool before you may be wondering “Why would I ever need a tool like this?”.
Instead of answering this question directly, lets ask some questions and see how NDepend can help.
Metrics that are can be good to know about your codebase:
- What methods and types are in my solution that aren’t in use?
- How reusable is my code? (Cohesion)
- Are there parts of your codebase where you are boxing your variables; maybe in a part of your application where speed is important?
- Are you aware of the code coverage your application has with Unit Tests?
- How extensible is each of your assemblies? (how many virtual, abstract classes does it have and how many interfaces?)
- If you have a third party dependency and wanted to remove it, are you clear on how big a job this would be?
If any of the above are not things you either keep an eye on, or even have answers for at all static analysis tools can help.
NDepend has over 88 different metrics that it will run against your assemblies, and 4 different kinds of graphs. The latter graphs really help you visualize what's going on in your project from a birds eye view.
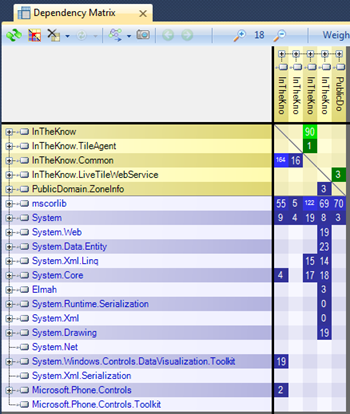
I’ve taken the liberty of analysing the codebase for my Windows Phone 7 app InTheKnow as I thought it might be interesting to see. I have a number of dependencies and some shared code in class libraries that are inherited by parts of my solution.
InTheKnow’s Dependency Matrix.
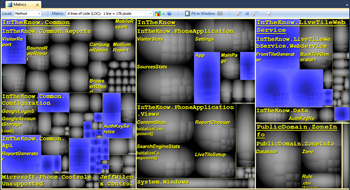
The next graph that I am now in love with is the metrics graph. This allows you to visualise a number of metrics and the part the play in your overall project.
Take my Method graph below – each box is the size of the each method in lines of code (you can change this metric to something else such as number of dependencies by choosing from the drop down at the top of the report).
The large blue boxes are the methods that are larger than the configured max size for a method (this is an editable rule) – in this case it looks like I have a bit of work to do in these areas of my project to make them easier to manage and maintain moving forward.
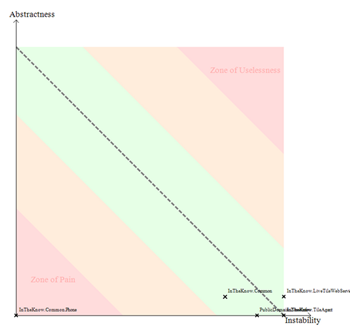
The next one that is also pretty cool is the Abstractness vs. Instability graph.
The Y-axis shows how Abstract each of your assemblies is. Are you able to extend your code without recompiling it? (Interfaces, Abstract Classes and virtual methods?).
The X-axis shows how unstable your assemblies are. Stable refers to the public surface area of your assemblies that cannot be easily changed because there are a lot of assemblies that are dependent on it.
An instable assembly has less dependant assemblies above it in the dependency tree. A value between 0 and 1 is given to each axis based on these equations and your assembly is placed on the graph accordingly.
The easiest way to read this chart follows this basic pattern:
- If your assembly is very stable (i.e.. lots of other assemblies depend on it) and it isn’t extensible (has no virtuals or abstract classes or uses interface based dependency injection) then it will be plotted in the bottom left of the chart named Zone of Pain (note my assembly “InTheKnow.Common.Phone” that is shared between my apps Background Worker and Phone application – obviously it isn’t very extensible at all…).
- If your assembly is abstract, extensible, but isn’t depended on by any other assemblies (it's not really being used) then it is plotted higher on the Zone of Uselessness.
Unique rule based scans
One of the features that sets NDepend apart from other tools like Nitriq is their unique CQL (Code Query Language) that allows you to write and edit your own scan rules for NDepend to run whenever it runs against your code base.
This enables powerful rules to be created to help you get a hold over where maintenance work needs to be done in your project
Take my example below that searches for methods in my codebase for parts that need refactoring (Are they too big? Too complex? Too many parameters or overloads?)
// <Name>Quick summary of methods to refactor</Name>
WARN IF Count > 0 IN SELECT
   METHODS /*OUT OF "YourGeneratedCode" */ WHERE

                                    // Metrics' definitions
  ( NbLinesOfCode > 30 OR           // http://www.ndepend.com/Metrics.aspx#NbLinesOfCode
    NbILInstructions > 200 OR       // http://www.ndepend.com/Metrics.aspx#NbILInstructions
    CyclomaticComplexity > 20 OR    // http://www.ndepend.com/Metrics.aspx#CC
    ILCyclomaticComplexity > 50 OR  // http://www.ndepend.com/Metrics.aspx#ILCC
    ILNestingDepth > 4 OR           // http://www.ndepend.com/Metrics.aspx#ILNestingDepth
    NbParameters > 5 OR             // http://www.ndepend.com/Metrics.aspx#NbParameters
    NbVariables > 8 OR              // http://www.ndepend.com/Metrics.aspx#NbVariables
    NbOverloads > 6 )               // http://www.ndepend.com/Metrics.aspx#NbOverloads
Have Metrics at all times with Continuous Integration
I mentioned earlier in the post that NDepend supports integration with your build environment out of the box.
It does this in the simplest form possible by offering a command line version of the tool. This is incredibly handy if you want to either run this as a scheduled task or through a build runner in your continuous integration environment like Jenkins, Team City or Bamboo.
If you are starting out on a new project, then like most operations in a project that are repeatable you should integrate your code metric runner from day 1 to help give you an idea of the flexibility and maintainability of your codebase over time – so plug NDepend in on day dot!
Usage for the command line runner:
NDepend.Console.exe [path to your NDepend .ndproj file]

Optional Parameters:

/ViewReport: to view the HTML report

/Silent: to disable output and eventual calls to Console.Read() on console

/HideConsole: to hide the console window

/Concurrent: to parralelize analysis execution

/XslForReport xlsFilePath: to provide your own Xsl file used to build report. The path specified must be absolute.

/InDirs dir1 [dir2 ...]: to override input dirs specified in the NDepend project file. The dirs specified must be absolute. If you use the /InDirs option, directories specified in the Xml NDepend project file are ignored.

/OutDir dir : to override the output dir specified in the NDepend project file. The dir specified must be absolute. VisualNDepend.exe won't work on the machine where you used NDepend.Console.exe with the option /OutDir because VisualNDepend.exe is not aware of the output dir specified and will try to use the output dir specified in your NDepend project file.

/EmitVisualNDependBinXml: to emit the file VisualNDepend.bin.xml VisualNDepend.bin.xml is an xml file that contains the dependencies 	graph of your application. It can be used for your own purpose. VisualNDepend.exe uses VisualNDepend.bin which is a GZipStream 	compressed version of VisualNDepend.bin.xml.

/Help: to display the current help on console
The team from NDepend have created a video to make it easier to walk through setting this up using NDepend in your CI environment.
Summary
Static analysis tools aren’t for every type of project, and you don’t need to break the bank by going and buying NDepend for all your team members. However, Static Analysis can give you the birds eye view that you need to get your codebase under control – NDepend gives you this capability in a level of detail that few other products can. Having an architect or two on your team using NDepend to keep an eye on the “Zone of Pain” and “Zone of Uselessness” will really pay off in maintainability over time and as we all know maintainability is one sure fire way of producing cost savings for your project over time. The additional fact that they have made it easy to plug NDepend into your Continuous Integration Environment with ease makes using this in in your next green field project’s build cycle from day 1 a no brainer.
Comments