Working with Stored Procedures and functions on a database tier can be time consuming, hard to debug and sometimes just difficult to get clarity on what is “happening”. A rarely discussed feature of Microsoft SQL Management Studio is its inbuilt debugging features. These allow you to see exactly what is going on, and step through your logic in a similar fashion to working in Visual Studio.
 I have spent a fair bit of time in SQL Management Studio of late, working on a legacy project at my new workplace. You can only imagine my sheer *delight* that nearly all the logic for the application in discussion is done on the database tier, using stored procedures, triggers and CLR functions. Just magic… (if you haven’t picked up the sarcasm yet, here is a prod…).
Because of my recent sustained trip to the land of pain, i have quickly had to work on my SQL fu to be able to solve problems and get to the bottom of their cause as quickly and efficiently as possible. Writing a whole bunch of print @MyVariableName to the screen just doesn’t cut it with complicated bugs. SQL Management Studio’s debugging tool helps reduce the time needed for this greatly.
End the Pain game
For the example i want to show you I'm going to walk you through a number of scenarios. I’m going to debug a bit of SQL that executes a stored procedure, and within that stored procedure I'll call a SQL function. The reason for this example being slightly abstracted is so that you can actually gather the power of this tool for working with complicated scenarios. I won’t show you, but the same techniques can be used to following the path of a Trigger after the event you have just fired happens.
Optionally you can avoid doing any of the below and simply pick up “how” i debug and apply it to a database you know and *maybe* love.
Demo Setup
Open SQL Management Studio and create a blank database.
Run the SQL script below in a new query window
GO
CREATE FUNCTION AddTwoIntegers
(
    @FirstInteger int,
    @SecondInteger int
)
RETURNS int
AS
BEGIN
    declare @TotalOfBothIntegers int
    -- add both of our two inputs together
    set @TotalOfBothIntegers = @FirstInteger + @SecondInteger
    -- return them
    RETURN @TotalOfBothIntegers
END
GO
create PROCEDURE GetAddedNumbers
    @StartNumber1 int,
    @StartNumber2 int
AS
BEGIN
    -- create an in memory table with three integers as fields
    declare  @ResultsTable table (
        Number1 int,
        Number2 int,
        TheirSum int
    )

    declare @counter int
    set @counter = 0

    -- loop through 10 times
    while @counter < 10
    begin
        set @counter = @counter + 1

        -- insert my values into my temp table
        INSERT INTO @ResultsTable
                    (Number1, Number2, TheirSum)
        VALUES
                    (@StartNumber1, @StartNumber2, dbo.AddTwoIntegers(@StartNumber1, @StartNumber2))

        set @StartNumber1 = @StartNumber1 + 2
        set @StartNumber2 = @StartNumber2 + 1
    end

    select * from  @ResultsTable
END
GO
This script which will create a new stored procedure, and a new function. The stored procedure takes in two numbers and loops through them 10 times adding 2 to the value of one number and 1 to the value of the other on each loop. It then calls a function to add the two numbers together and return the results as a table. While you may think this demo’s precedent is stupid, the abstraction is only for me to illustrate moving in and out of called functions etc.
Let the debugging begin
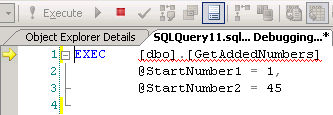
In a new query window in SQL Management studio enter the following SQL query to fire our newly created stored procedure:
EXEC    [dbo].[GetAddedNumbers]
        @StartNumber1 = 1,
        @StartNumber2 = 45
In the top bar of SSMS click on the little arrow that looks like a play button – this will fire up the debugger.
![]()
You’ll notice that this puts a little debugging arrow next to the line that is being executed.

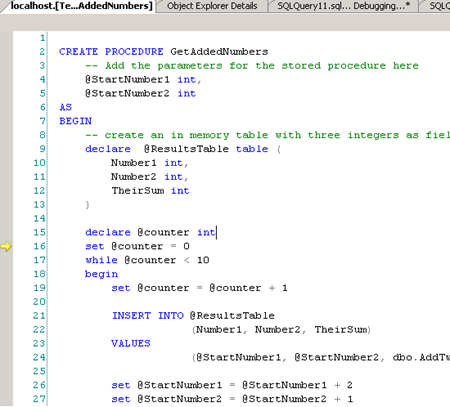
Because this is a stored procedure, we want to step into it so that we can debug what happens inside the stored procedure. To do this either press F11 or click the step into icon in the tool bar.

This will take us inside the stored procedure called GetAddedNumbers (yes i should chosen a better name, but i wrote this post in a rush so my n00b hat was on) so that we can step through it.

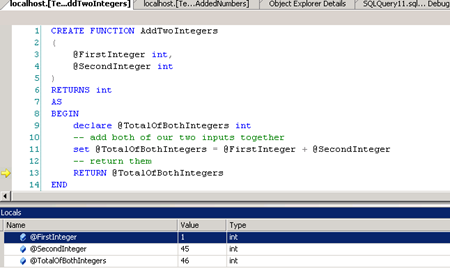
You’ll also notice something that is really important and that is the list of variables in scope at the bottom of the screen. This is a really powerful tool as although you can’t hover over a variable to see it’s contents like you can in Visual Studio, you can see its value as you step through so that you can pick up it’s changes.

Press F10 to step through the stored procedure until you have the yellow arrow sitting next to the insert statement inside the loop. Because we want to step inside this insert statement we’ll press F11 (or use the button used above).
This will take us inside the function we created and allow us to step through it – as you can see in my screen shot below i have stepped through until the end of the function (using the F10 key) and can see the values of both my inputs AND the calculated value.

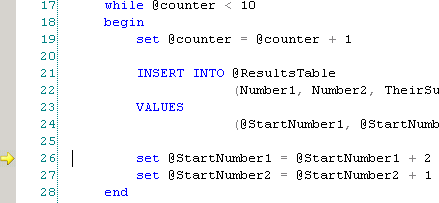
We can then step back out by pressing either SHIFT+F11 or by pressing the step out icon.

This will take us back out to the scope of the loop in the stored procedure where i can continue stepping through past the INSERT statement.

You can then keep stepping through all the loops above until the result is returned. Very simple and yet very powerful.
“In closing I’d like to say…”
As you’ve hopefully gathered from the above, although working on database systems that drive you mad can be hard, Microsoft SQL Management Studio’s debugger can help to offset the time its takes for this madness to take hold (it’s too late for me, but save yoursellllfff). Add this tool to your bat belt and one day you’ll probably have junior developers in awe at your ninja stylee… or something.
Comments