When it comes to reviewing visitor site usage, server bandwidth usage, or forensic security investigations; IIS log files often hold the answers. Although as I'm sure you’re more than aware, gigantic text files can be hard to view let alone pull intelligence from. Investigating a website attack can be really daunting when looking at log files as an information source. In my previous post I covered a tool to help with Windows Security Logs. Lucky for us it’s just as awesome when dealing with huge IIS logs.
This is part 2 in a 2 part series on reviewing actual or investigating potential website security intrusions on IIS hosted websites. View part 1 here.
Image credit: Jim B L
Information overload…
IIS Log files are great as they store the timeline of all usage on your website. If you know where to look, you can retrieve information that helps draw conclusions on so many different visitor scenarios. In the context of security, if you’re armed with the knowledge of what to look for, IIS log files can be a great tool to forensically review an attackers behaviour; whether they have been passive in their prodding of your application by just sniffing around or active by actually trying to break things.
Fields of Gold
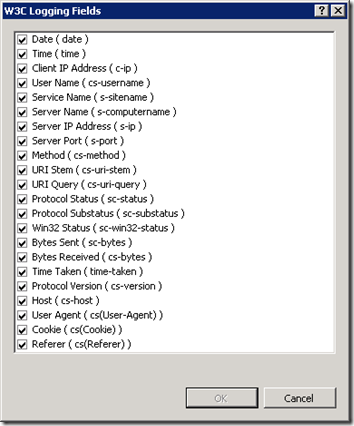
When setting up your website, IIS can log a significant set of data; but not every option is turned on. To turn on full logging, open IIS Manager, select your server’s root node and select “Logging”, then open up the “Select Fields” button.
Select every option to include as much data as possible.
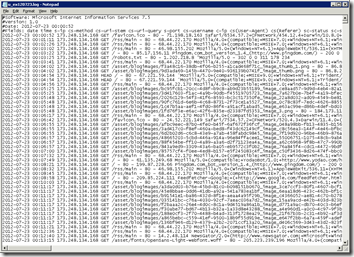
Once you have this turned on, you’ll end up with a sea of information in these log files. On a busy website, these files will probably be too large to open in notepad.
Log Parser to the Rescue
As I covered in my previous post, opening and then scanning huge logs can be a daunting task – luckily Microsoft Log Parser 2.2 solves this problem with a tool that makes it easy to query multiple huge log files using well known SQL in record time!
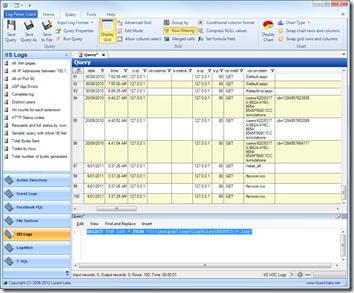
Log Parser Lizard takes this one step further by allowing you to do this from a GUI interface.
To prove this point, load up Log Parser Lizard and write a simple query against the whole log folder (not just a since large file, but many) for one of your IIS sites:
SELECT TOP 100 * FROM 'C:\inetpub\logs\LogFiles\*WEBSITE LOG FOLDER*\*.log'
Pretty cool, eh?
So you’ve got log files, you’ve got a kick ass tool to query them, but what queries will help you make sense of the data or track down the evil doers?
First look: Security queries
To start with, you need to think of the context you’re looking at when querying your log files in. In issues where someone has attacked your site in the past, you’re probably in the search for answers on how.
If so, do you have an incident time to start trying to track down how it happened?
Getting a feel for when/how
Maybe try a query for a certain date/time:
SELECT *
FROM 'C:\inetpub\logs\LogFiles\*WEBSITE LOG FOLDER*\*.log'
WHERE date = '2012-07-26' AND time BETWEEN TIMESTAMP('02:03:00','hh:mm:ss') AND timestamp('02:07:00','hh:mm:ss')
Or maybe you just want to start by looking for server errors as a start, to see if an attacker was testing your website for vulnerabilities?
Query looking for server Http response code 500:
SELECT *
FROM 'C:\inetpub\logs\LogFiles\*WEBSITE LOG FOLDER*\*.log'
WHERE sc-status = 500
Another handy behaviour to look for is where you have a secure admin section. Most admin sections on websites redirect you if you aren’t logged in. They usually do this with a 302 redirect.
So let’s look for visitors trying to access your site using the relative URL “/admin/*” and who’re being redirected using 302 headers. While this will show some false positives for wherever you’ve tried to log in and forgotten the password, it’ll also give you an idea if someone is sniffing around.
SELECT *
FROM 'C:\inetpub\logs\LogFiles\*WEBSITE LOG FOLDER*\*.log'
WHERE  cs-uri-stem LIKE '/admin/%' AND sc-status = 302
Following a security trail
Once you have what looks like an intruder poking around, you then want to see what else they’ve been doing – and you should have their IP address from the previous query so we can query the logs for them:
SELECT *
FROM 'C:\inetpub\logs\LogFiles\*WEBSITE LOG FOLDER*\*.log'
WHERE s-ip='*IP ADDRESS OF ATTACKER*'
You can also see how much traffic is coming from single IP addresses by querying for each of their total usage – this might show someone attempting to brute force your site over time.
select TO_LOCALTIME(QUANTIZE(TO_TIMESTAMP(date, time), 3600)), count(*) as numberrequests
from 'C:\inetpub\logs\LogFiles\*WEBSITE LOG FOLDER*\*.log'
group by TO_LOCALTIME(QUANTIZE(TO_TIMESTAMP(date,time), 3600))
order by numberrequests desc
You can then query your logs for how many requests are coming from certain IP addresses to your “admin” section, again seeing brute forcing issues.
select TO_LOCALTIME(QUANTIZE(TO_TIMESTAMP(date, time), 3600)), count(*) as numberrequests
from 'C:\inetpub\logs\LogFiles\*WEBSITE LOG FOLDER*\*.log'
where (cs-uri-stem like '/admin/%')
group by TO_LOCALTIME(QUANTIZE(TO_TIMESTAMP(date,time), 3600))
order by numberrequests desc
Non security related queries
Checking for incoming broken referral links:
SELECT DISTINCT cs(Referer) as Referer, cs-uri-stem as Url
FROM 'C:\inetpub\logs\LogFiles\*WEBSITE LOG FOLDER*\*.log'
WHERE cs(Referer) IS NOT NULL AND sc-status = 404 AND (sc-substatus IS NULL OR sc-substatus=0)
Top 10 slowest pages/files to load:
SELECT TOP 10 cs-uri-stem, max(time-taken) as MaxTime, avg(time-taken) as AvgTime
FROM 'C:\inetpub\logs\LogFiles\*WEBSITE LOG FOLDER*\*.log'
GROUP BY cs-uri-stem
ORDER BY MaxTime DESC
Traffic by day:
Select To_String(To_timestamp(date, time), 'MM-dd') As Day,
    Div(Sum(cs-bytes),1024) As Incoming(K),
    Div(Sum(sc-bytes),1024) As Outgoing(K)
From 'C:\inetpub\logs\LogFiles\*WEBSITE LOG FOLDER\*.log'
Group By Day
Summary
Log Parser is an awesome tool for querying large log files. Log Parser Lizard makes this even easier with the addition of a GUI interface. For extremely large files I prefer to use the command line client for speed, but using the GUI to build your queries makes like just so easy – all of a sudden your information overload becomes a high signal/noise ratio sweet symphony that can help you either get a better feel for how your site is being used, or in the worst case scenario help you track down an evil doer and how they got in.


Comments