Microsoft SQL Server's Profiler is a necessity when digging around on a SQL server trying to find any bottlenecks or long running queries. How you personally lock down your profiling session to show only your application's data access appears, from the experience of looking over others' shoulders as well as how I personally go about it, to be a "how you taught yourself one day when first debugging queries". Like most things in dev-land someone had this problem WAY before you and there is a final, easy solution.
"I'm Awesome, and have known this since before MS SQL existed"
If you start to read the below and think "I can't wait to write a comment informing all the n00bs out there how awesome I am for already knowing about this", don't waste your keystrokes - In my experience you are in the minority in your knowledge, so continue on your way feeling like a ninja.
Using the "Application Name" Parameter in your Connection Strings
When defining your application's database connection string you add the usual bits that you've done before a million times. You add your server name, your username, your password, and your database name/initial catalog – but there is an Easter egg waiting to be found in the realms of connection string awesomeness just wanting to be known. The "Application Name" parameter.
server=MyServer;database=MyDatabase;Integrated Security=SSPI;Application Name=MyApplication;
This little gem adds a flag to all your application's requests that makes it trivial to profile just your application's requests.
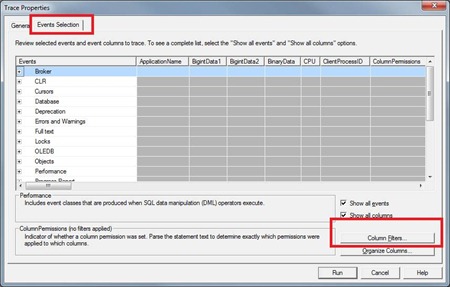
When setting up a new profiling session next in SQL Management Studio, shift to your Events Selection tab of the profile setup screen, then click the Column Filters button.
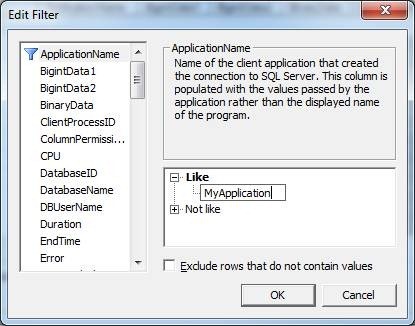
Then in the first item in the list Application Name enter your Application's Name as per your connection string.

Start your profiling session and your done!

Comments